
Reports Show Your Company Culture
When working with companies, one of the main things I look for is the reporting system and what information is being delivered every month. The reports are always interesting, as they show me what kind of company this is, even without experiencing the culture. Marketers feel helpless when all that seems to be requested or generated are the basics: unique visitors, time on site, rankings, etc. As a rule, there is a difference between Reporting and Analysis.
Reporting v. Analysis
Reporting is a simple assessment of the question: “what happened?” It shows the difference (usually one month compared the the previous month) of visitors, visits from search engines or social media, bounce rates and other information that on the surface seems important, but does not answer the question “WHY?” That is analysis.
Here is an example from a web stats provider which puts all of these types of reports into an infographic format.
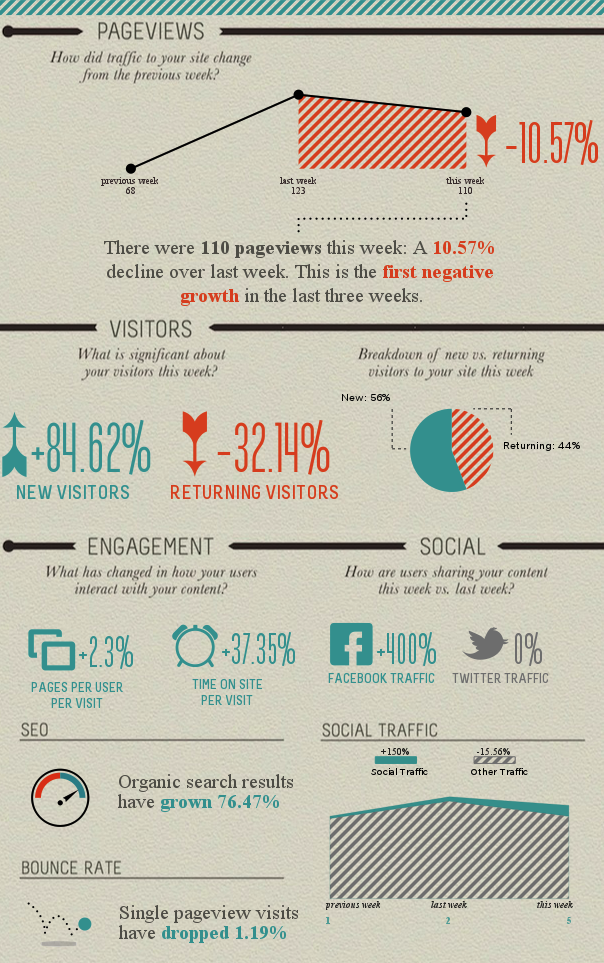
Web Analytics presented as an Infographic
Now, the curious thing about these stats is that I have many companies call me to explain this and similar types of information to them. The conversation starts with the same question: “What is this telling me?”
Interestingly, this infographic report of the website activity is impressive in its visual quality and leads people to believe that it is much more important than it is. The problem is that by its nature, it looks informative, but it isn’t. Here’s what I mean:
The growth in new visitors since last week looks really impressive – up 84%,
Similarly, Facebook traffic is up 400%,
SEO (organic Search results) have increased 76%,
…and the bounce rate has dropped 1.19%
Visually, this is impressive, and makes sense to the website owner. These numbers in a meeting look nice, show progress and give the impression of success. But what happens once someone asks a question? That’s when the impressiveness of quality graphics comes crashing down around you. No amount of pretty colors, attractive graphics and 3-D charts will change the quality of information contained in them.
This information needs more information to answer the question “Why?”
Analysis
Analysis approaches the goal differently. Rather than producing a report card, analysis strives to answer the causes of up and downs, correlations between events and response,s and how different events can influence people to take actions. Analysis asks the question, “Why?” Because of that question, the charts, numbers and graphics lack value because they look great on the surface, but provide no information about why traffic increased, what made Facebook refer more people or why the bounce rate dropped 1%.
Analysis sets out to interpret events and behavior. When you can answer why something happens, you can adjust the course or the behavior to get a different (and hopefully improved) result. In understanding the why, you can make an informed decision to change; layout, copy, campaigns – anything.
Action
Knowing the WHY gives you the ability to change. Knowing the HOW is the result of experience. Once you have access to the WHY of action and causation, you need to practice consistent questioning of what to do with the information. This is where companies can create culture of data-based decisions in three easy steps:
- Ask WHAT happened,
- WHY it happened,
- and HOW do we react to it?
In this three-stage process it requires the first stage of reporting, but in a way to find anomalies or to create questions in the data to explore for causative factors. The second question filters down to the actual events that can be proven to create more revenue or profitability. The third forces an organization to take action on the data. And this is where the culture becomes obvious. If nothing is acted upon or changed in the light of new discoveries or convincing data, then the previous questions are worthless.
If you want to save time and money in your organization, look for all the the reporting that doesn’t answer “why?” and eliminate it. Then, look for all of the reports that provide no calls to action, and eliminate those. It’ll either make your company better or expose what is really important in the company culture; such as numbers, rather than success.