Finding the most valuable data for your business within Analytics can be tedious work. You may also find yourself navigating in discouraging circles, enduring distractions that cause you to forget what you were analyzing, or completing the same tedious steps to generate the same report every month. Google Analytics has provided several basic tools to help eliminate these scenarios. I will outline these tools using the Leopard Nation website.
1. Segments
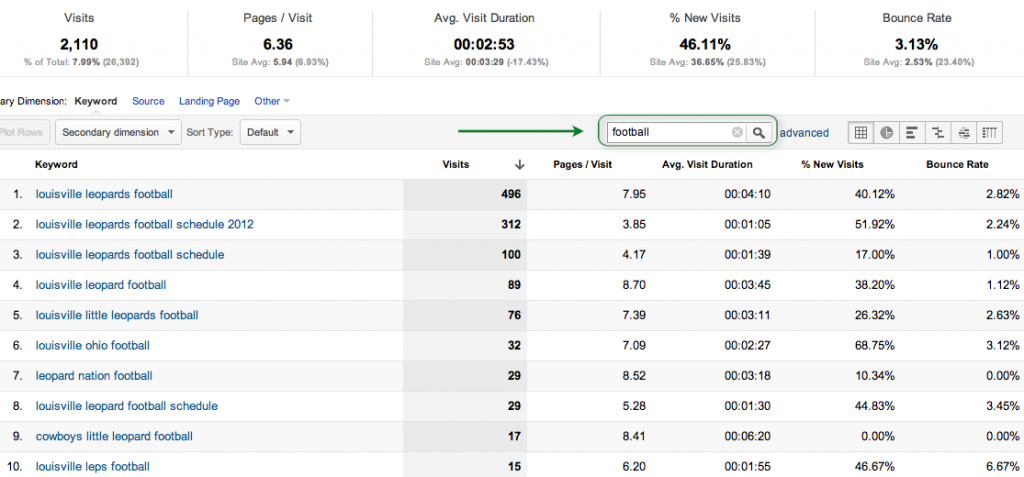
It can be very easy to get caught up in the overall data provided on the dashboard or in any standard report. However, the key to fully analyzing the data of your business lies within segmenting out your traffic. One quick way many users segment their data is through the filter within each standard report. For the purposes of this section I will be segmenting search data for the term “football” as this is the most popular sport for my website. Below you can see the segmented data:
At the top you can see the total metrics for the entire segment as well as the top 10 keywords that contain “football” with their own corresponding data. Even though this is a simple example, let’s say that this segment is one that you use on a monthly, weekly, or even daily basis for your reports. You can easily use this segment at anytime by recreating it under advanced segments.
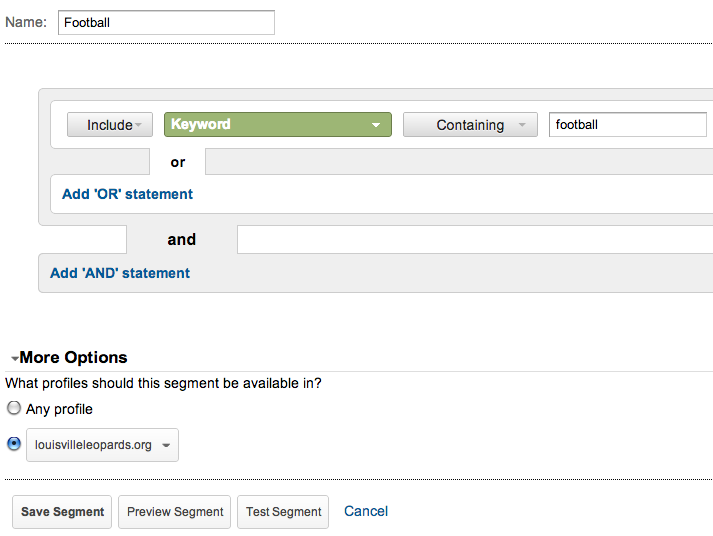
Click on “Advanced Segments” at the top of analytics and then on “+New Custom Segment” button on the bottom right corner of the drop-down box. You will then be taken to this page:
First name your segment in the top form box. Then choose the type of traffic you want to filter in the green box, which in this case is “Keyword.” Fill in the rest of the necessary information in order to create your segment and under more options select which profiles you will be using this segment on. Unless you have several related sites, you will likely want to chose the second option with the website you are working with. Click “Save Segment” and your segment will be created.
Your segment now appears under “Advanced Segments” in the “Custom Segments” section. You can simply click your segment and hit the “Apply” button and your segmented data will be filtered out throughout all of Google Analytics.
2. Custom Reports
Using Custom Reports is another feature that Google Analytics provides to save you endless amounts of time. This will particularly help if you are generating reports with the same basic data month-to-month, week-to-week, or even day-to-day data.
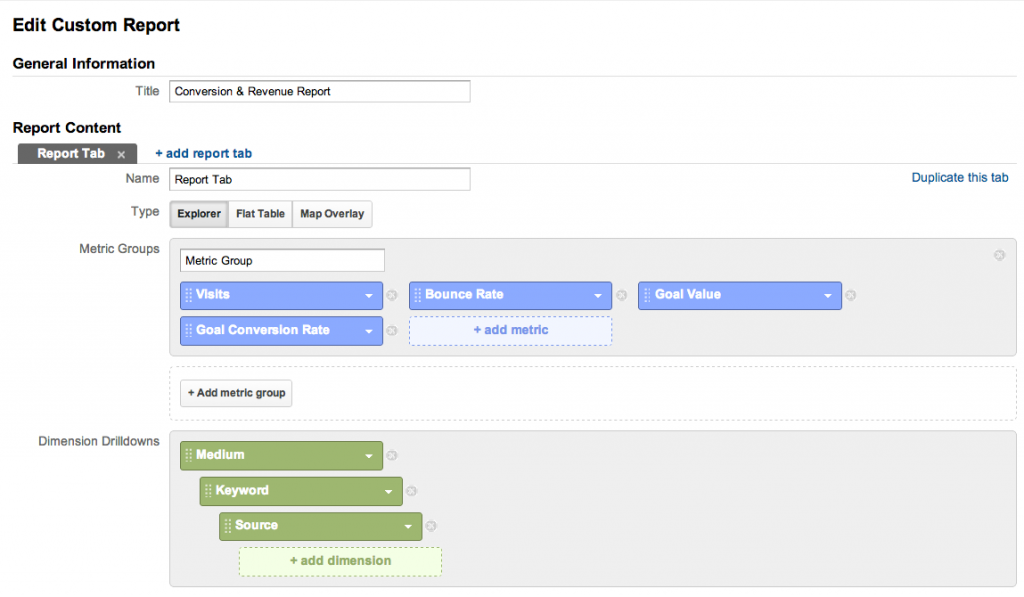
To create a custom report click to go to the “Customization” section of analytics and then click “+New Custom Report.”
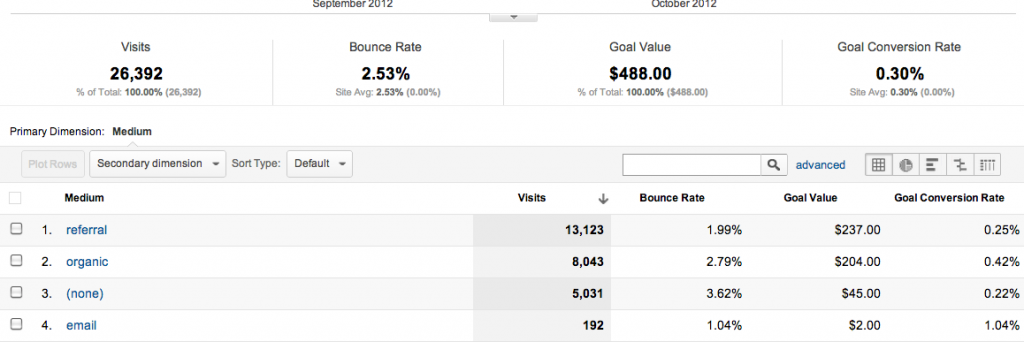
After that, you can edit your custom report to include whichever metrics you want to show as well as how you want your data to be drilled down. For this report, I chose some basic metrics to show which mediums were the most successful in attracting, keeping, and converting visitors on my site.
From this sample report we can see that referral traffic brought the most visitors to the site and generated the most overall goal revenue. However, it was organic that converted the best overall. So if we click on “organic” we can narrow our data down even more:
After sorting by “Goal Value” we can now see which keywords generated the most goal revenue overall. As expected for this local site, most of these keywords are branded terms.
You can also sort by referrer or other mediums to see which sites are bringing in high converting traffic, the most visits, etc. All the data will be there in the custom report and you can return to it anytime under the “Customization” tab.
3. History
The way I see it, life can be broken down into the segmented graph below. 
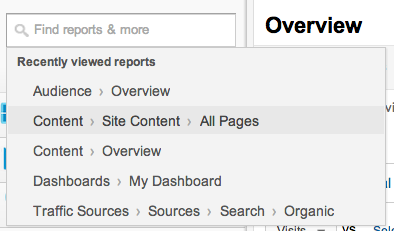
In the upper left-hand corner there is a reports search box. Simply click on the search box in the upper left-hand corner that reads “Find reports & more” and the last five reports that you were working on for that particular website will be displayed. Click on any of them to simply revert back to which report you were on in analytics.
4. Shortcuts
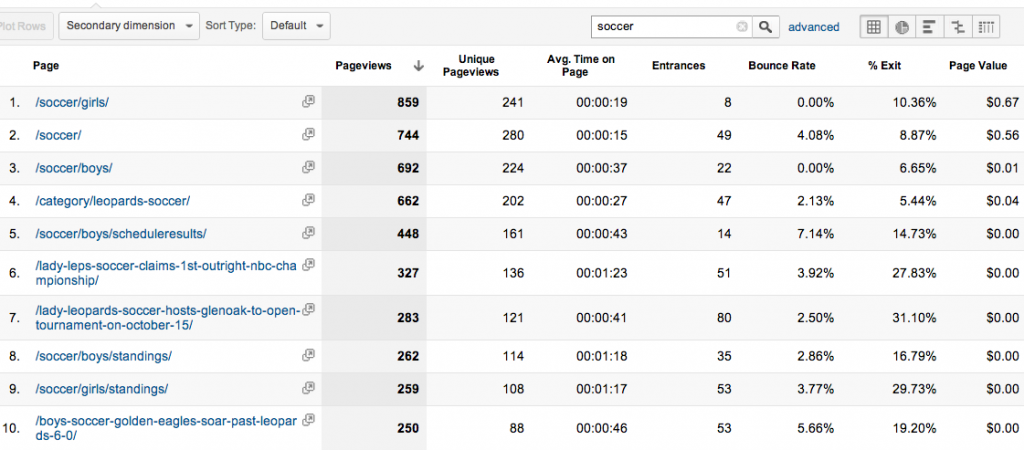
Similar to the history feature, Google Analytics also allows you to save shortcuts to any report within analytics. This feature works like saving a bookmark and can be very useful if there is a report that you view on a regular basis.
As a basic example above, I have filtered out URL’s that contain “soccer” within them.
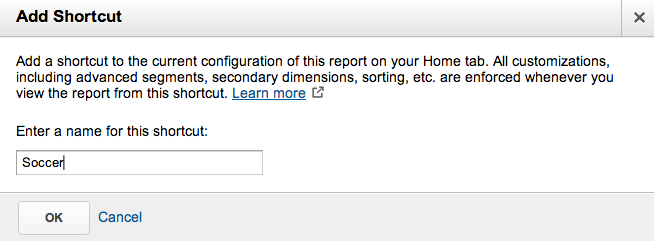
I can then click on the shortcut button at the top of the page to name and create this shortcut that will take me to this exact filtered out report.
The shortcut will then appear on the left sidebar under “Shortcuts” and then I can easily navigate to this “Soccer” report at anytime.
Diving into Google Analytics can be stressful and tedious, but it does not have to be. You can save time and stress if you learn to use the tools and features provided, or just ask an analyst. Leave your analytics comments or questions below.

