
The Red Shirt Phenomenon
In my seminars, I enjoy teaching analytics because the fun is in finding effective and memorable methods to help people understand the concepts. One of my favorites is an analysis of the Red-Shirt Phenomenon in Star Trek.

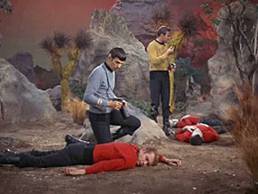
What? You don’t know about the Red Shirt Phenomenon? Well, as any die-hard trekkie knows, if you are wearing a red shirt and beam to the planet with Captain Kirk – you’re gonna die. That’s the common thinking, but I decided to put this to the test. After all, I hadn’t seen any definitive proof; it’s just what people said. (Remind you of your current web analytics strategy?) So, let’s set our phasers on ‘stun’ and see what we find . . .
The basic stats:
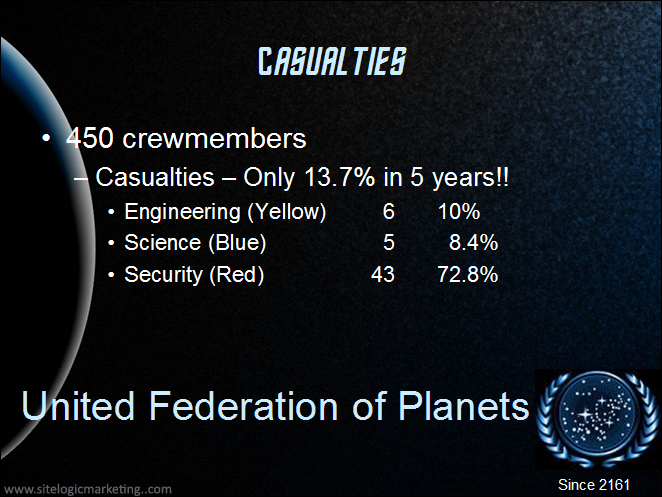
The Enterprise has a crew of 430 (startrek.com) in its five-year mission. (Now, I know that the show was only on the air for 3 years, but bear with me. 80 episodes were produced, which gives us the data to build from.) 59 crewmembers were killed during the mission, which comes out to 13.7% of the crew. So, that will be our overall conversion rate, 13.7%.
Data Segmentation:
However, we need to segment the overall mortality (conversion) rate in order to gain the specific information that we need:
- Yellow-shirt crewperson deaths: 6 (10%)
- Blue-Shirt crewperson deaths: 5 (8 %)
- Engineering smock crewperson deaths: 4
- Red-Shirt crewperson deaths: 43 (73%)
So, the basic segmentation of factors allows us to confirm that red-shirted crewmembers died more than any other crewmembers on the original Star Trek series.
However, that’s only just simple stats reporting – ready for some analysis?
In-depth Analysis:
Analysis involves asking questions about the data. Analysis attempts to bring reason and cause to the reported data in order to find why something is happening. With that data, one can improve the situation based on the intelligence gained from the analysis.
Q: What causes a red-shirted crewman to die?
- On-board incident – 42.5%
- Beaming down to the planet – 57.5%
There were also many fights during the mission; on the Enterprise, on planets, and various space stations. The fights were also divided between alien races or crazed crewmen (usually wearing red shirts).
- There were 130 fights over 80 episodes.
- 18 of the 130 fights resulted in a fatality.
- 13 of the 18 fatal fights resulted in a red-shirt fatality.
Q: what was the rate of red-shirt casualties?
- 18 red-shirt fatality episodes:
- 8 multiple fatality occurrences; involving 34 red-shirted crewmen.
- 9 single red-shirt fatality situations.
It was found that red-shirted crewmembers tended to die in groups. In 17 red-shirt fatality episodes, 8 were multiple incidents, 9 were single incidents. In a little less than 50% of the fatal red-shirt situations, multiple crewmen were vaporized.
Q: What factors could increase/decrease the survival rate of red-shirted crewmen?
Besides not getting involved in fights, which usually proved fatal, the crewmen could avoid beaming down to the planet’s surface, which is inherent to their end. However, that could result in a court-martial for failure to obey orders.
Besides not beaming down, another factor that showed to increase the survival rate of the red-shirts was the nature of the relationship between the alien life and captain Kirk. When Captain Kirk meets an alien woman, the survival rate of the red-shirted crewmen increases by 84%. In fact, out of Captain Kirks’ 24 “relationships” there were only three instances of red-shirt vaporization.

The caveat to this is when Captain Kirk not only meets the local alien women, but also starts a fight among alien locals. The combination of these events has led to the elimination of 4 crewmembers (3 red-shirts).
Here are the statistics:
Red Shirt Death episodes = 18
Episodes with fights = 55
Probability of a fight breaking out = 70%
Kirk “relationship” episodes = 24
Kirk “relationship” + fights = 16
Kirk “relationship” + red shirt casualty= 4
Red shirt death + fight + Kirk “relationship” = 3
And the data trends;
Probability of a red-shirt casualty= 53%
14% of fights ended in a fatality (with a 72% chance the fatality wore a red shirt)
Probability of a red-shirt “incident” when Kirk has a “relationship” = 12%
The red-shirt survival rate is slightly higher when Kirk meets women than when a fight breaks out. This trend necessitates the question: How often did Captain Kirk “meet” women? In 30% of the missions.

As the data shows, Captain Kirk meeting alien women has an impact on the crew’s survival. The red-shirt death rate is higher when a fight breaks out than when Kirk meets a woman and a fight breaks out. Yet the analysis shows that meeting Kirk meeting women only happens in 30% of the missions.
Conclusion:
We can reliably improve the survivability of the red-shirted crewmen by only exploring peaceful, female-only planets (android and alien females included).
Reporting the Data:
Now, researching the data can be fun and informative. However, that is only half of the battle. The interesting part comes when you have to communicate not only the data, but your conclusions in an effective, persuasive manner. The best analysis won’t go far if you can’t communicate the conclusions in a manner that people understand.
There are a few options at our disposal. First, the PowerPoint Method.

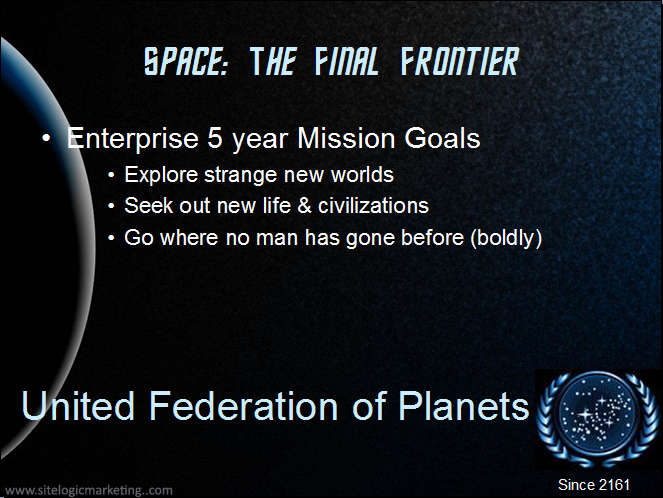
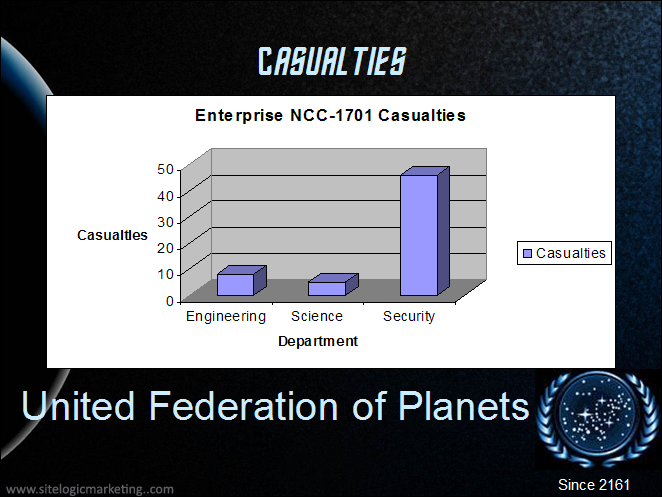
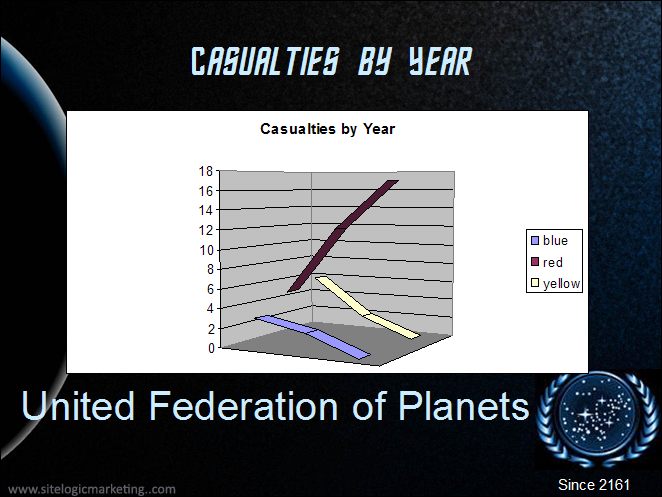
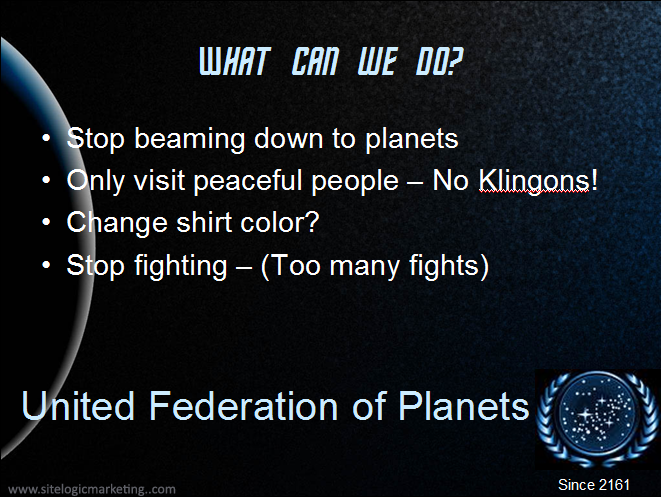
There are a number of things wrong with the typical method of presenting data. For starters, this presentation could bore even the most hardened Starfleet manager (CEO). The typical corporate PowerPoint slide design is obnoxious and does not leave room for information, the charts are redundant, even unnecessary, and it does not do a good job of communicating the information or the analysis.
In most cases, PowerPoint is NOT the recommended tool for communicating analytics data. It is not the right tool for the job. Communicating analytics data involves providing conclusions based on facts, tests, comparisons, and research. In order to display the necessary data, a better method must be used, and not one that forces redundant bullet point and “snazzy” charts.
Visualizing the Data:
There are some necessary elements required in developing a chart for this type data:
- A list of the specific episodes
- Events that happened in each episode
- The number of events that happened in each episode
- An easy way to identify data, then compare and contrast actions in all episodes
By seeing all of the available data in one chart, associations, patterns and conclusions can be drawn simply by comparing the relationships as they are presented. This is something that I learned from Edward Tufte – 1. More information is needed to simplify data presentation. 2. Unless all of the data is presented, there is no data integrity.
Information is Primary to Design
This is critical in developing a chart of information – the information is primary. List the necessary data elements first. Then, develop the design around the information, and not the other way around. Otherwise, a beautiful chart will lack the critical information necessary to support your conclusions. The graphing software that I found extremely effective for communicating the episode data for this Star Trek analysis is Microsoft’s Office 2007, and in Apple’s OS X graphics software.
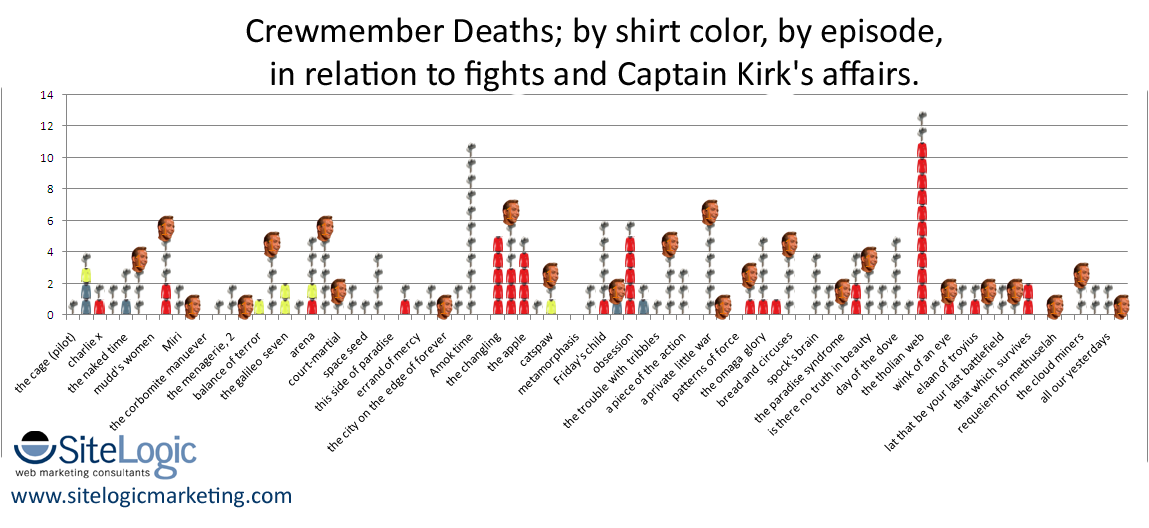
click for full-size version
I like this chart – eliminating the need for a legend is critical to allowing the information to flow. The data is the same color or object as the information we are trying to convey. Because there is no suitable color for Captain Kirk’s affairs, we substituted a very flattering picture. Fights are represented by tiny phasers, which are not the best representation because of the size, but can easily be determined by the process of elimination. This chart allows conclusions and observations that simple charts, numbers, and explanations may never bring to the surface. It allows for easy comparison, both to other shirt colors, and in relation to other episodes. It also looks as though Kirk was a very busy man.
In the first year of the series, red-shirt casualties were lower than other color-shirted crewmembers. The second and especially the third seasons were especially brutal. In the third season, only red-shirted crewmembers died; maybe because the other colors enacted better safety protocols, or maybe because they avoided the bridge when a new planet came into view, for fear of beaming down with Cpt. Kirk.
Summary:
Of the elements that helped to provide this analysis, segmentation was key. Segmentation of groups allows for comparisons. Comparisons allow you to spot trends that by be different from the rest. Asking questions of the data allows you to dig into specific trends and spot additional factors that have affects the original analysis. Unless we dug into Kirk’s personal life, we may never have spotted the contrast of Kirk’s attraction to alien females as it related to saving red-shirt crewmen’s lives.

Remember, when you have to account for lost crewmembers, your report needs to account for the how, the why, and the ability to draw specific conclusions as to how to affect the trends in the future. Depending upon your approach, you could either doom the project, and future red-shirted crewmen, or you could be visiting planets full of peaceful alien women.
Addendum:
I found this motivational poster, that could well be hanging in a cubicle at Starfleet headquarters.

Related Articles on the Marketing Logic blog:
Analytics: Is it Fun or Easy: Part 1
Analytics As a Subversive Activity
Search Engine Optimization Basics
Want to Know More About Analytics?
Enroll at Learn@SiteLogic to learn the most in-demand digital marketing skill.